Senior management has a bone to pick with marketing, and I don’t blame them.
For years they’ve invested in “digital marketing solutions,” testing different things, watching and waiting to see results. What do they usually get for their investment? A spreadsheet showing them impressions, clicks, click-thru-rates, cost-per-click, maybe a conversion or two if they are lucky.But unless each conversion results in an actual sale, the company brass is unlikely to be impressed. They are interested in one number the analytics never seem to show: new customers.
The evolution of performance accountability in digital marketing has left a bad taste in the mouths of businesses, especially in technical fields dominated by engineers who have never felt much affinity for marketing in the first place. When they eventually realize marketing is a necessity they will hire someone to manage it for them, and that person will face a mountain of skepticism every step of the way.
Things are different today, though. You can invest in a marketing platform that tracks leads, not impressions and clicks. We use HubSpot for this very reason.
{{cta(’50e5349d-3be4-47d9-b390-17f18861c795′)}}
Before giving you a tour of the analytics, I should clarify exactly what HubSpot is. It’s a marketing and sales platform driven by your company’s ability to create and distribute content your customers are interested in. It’s a powerful strategy that requires consistent effort, and many companies to hire an inbound marketing agency to manage it for them.
Regardless of whether you are looking for smart tools for your in-house team or outsource your marketing to an agency, you will be impressed by the insights HubSpot offers. Without further ado, let’s look at the analytics and show you some real ROI.
The Dashboard
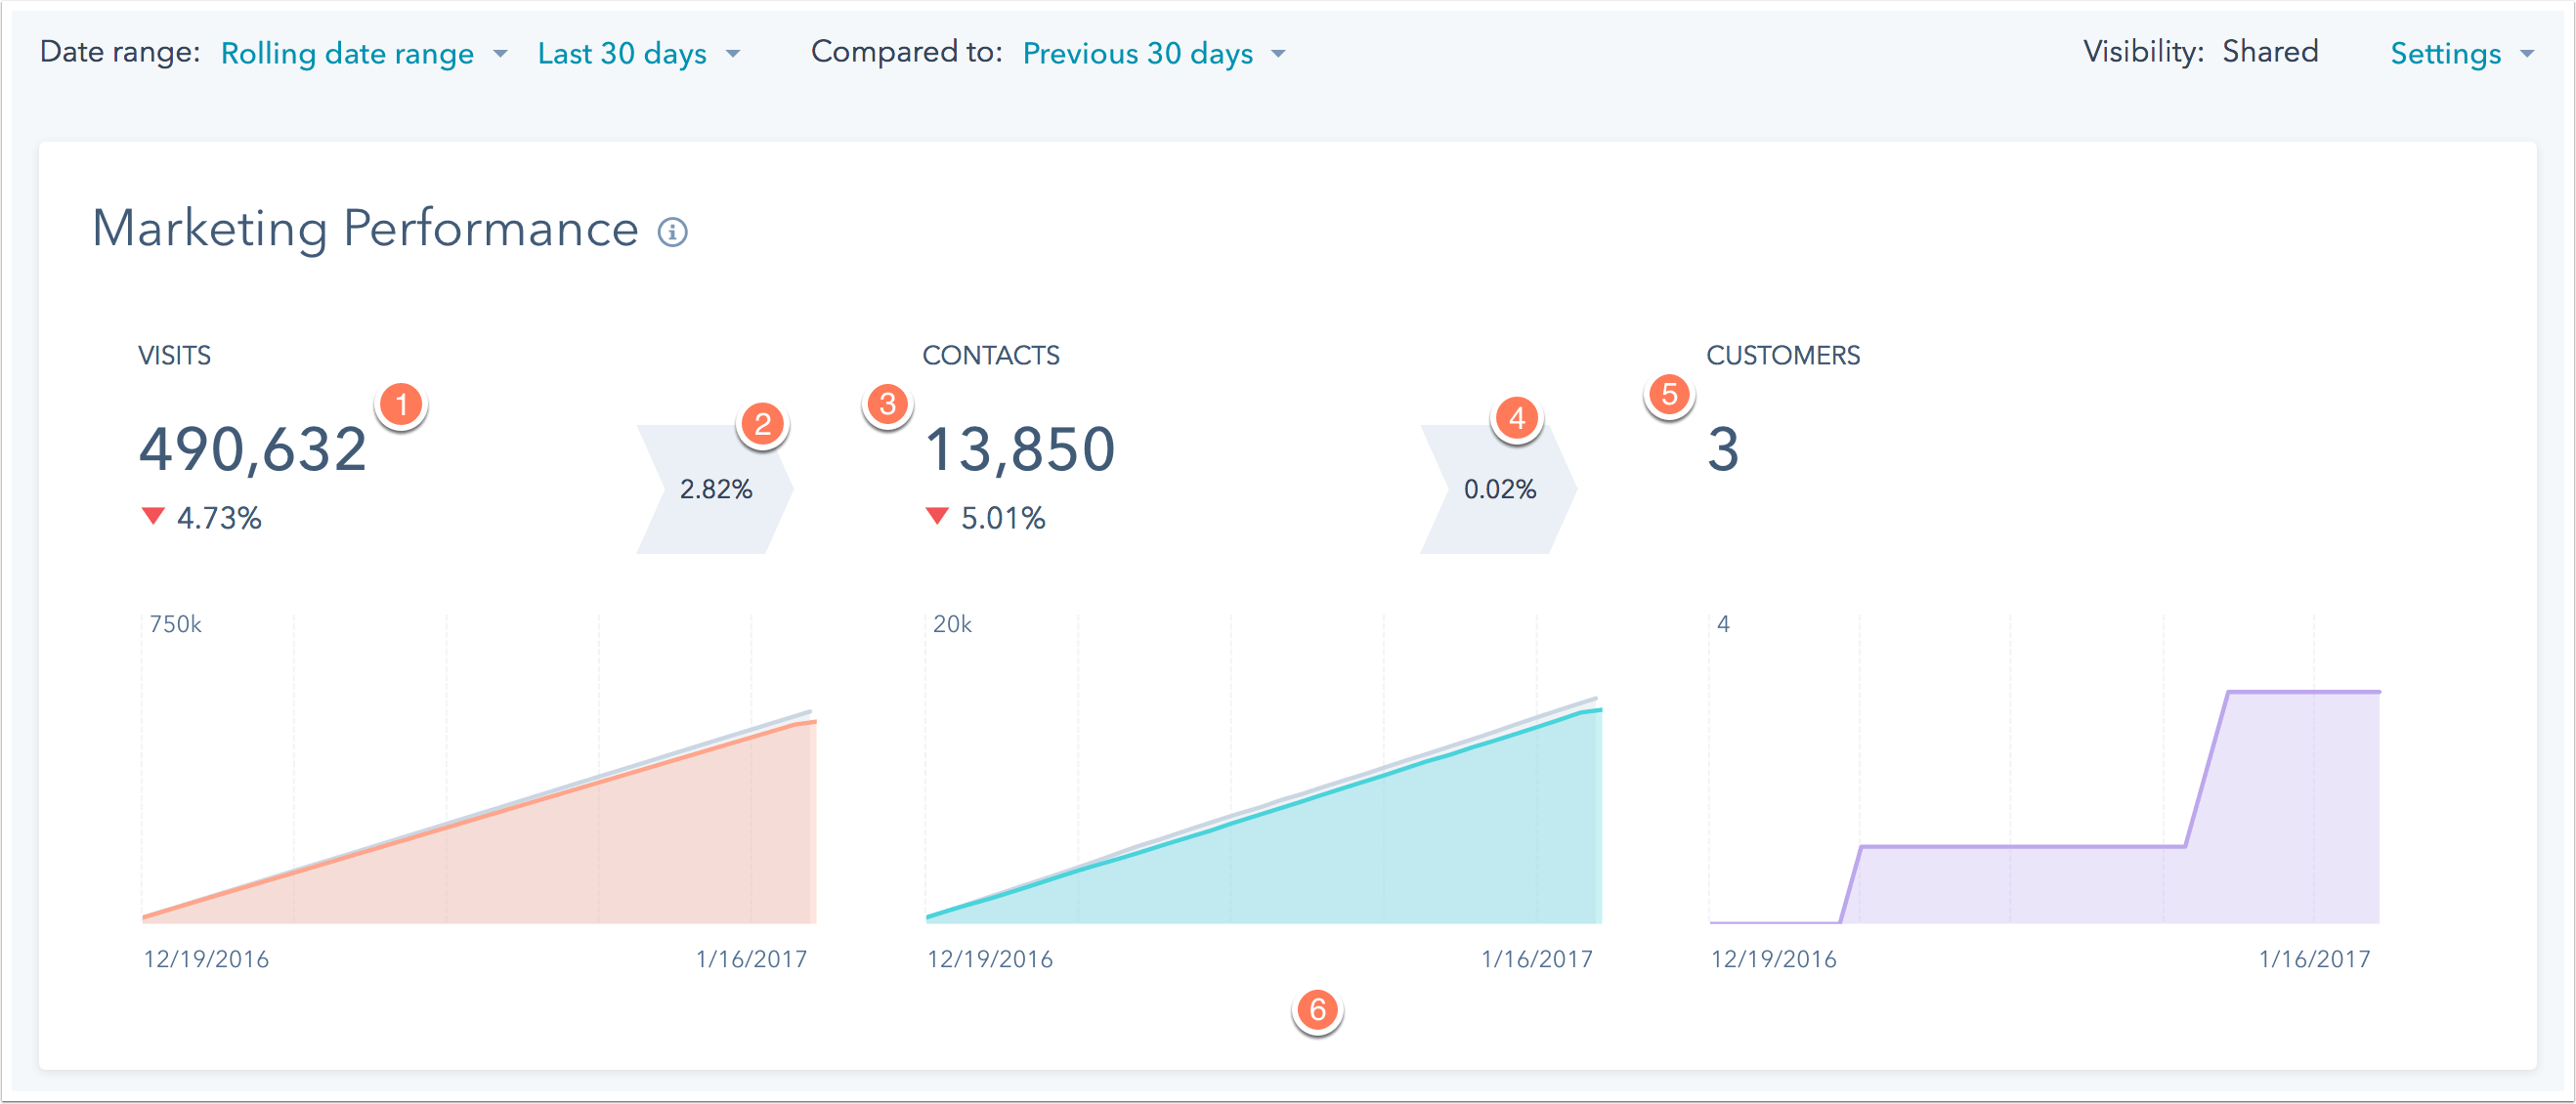
When you log in, HubSpot takes you to the Dashboard where you get a big picture view of your marketing. You will see how many new visits, contacts (blog subscribers and leads), and customers your company has brought in, along with the performance of several components that assist in customer acquisition. One important thing to know – your customers appear in the analytics according to the month they first converted, rather than the month they signed on the dotted line and became your customer.
The Dashboard is great for getting a snapshot of how your inbound campaign is performing on multiple levels:
- Visits – measures how many times people have visited your site from another source
- Visits-to-Contacts – the percentage of leads gained from user visits
- Contacts – the number of new subscribers and leads gained in a set period of time
- Contacts-to-Customers – the percentage of new customers gained from your leads
- Customers – the number of new clients who first converted in your given timeframe
- Graph that compares one time period to another

Image Provided by HubSpot
These analytics allow you to monitor trends with your conversion rates. If things are sliding in the wrong direction, you can compare what pieces of your campaign were performing better in previous months and adjust your strategy.
Contacts & Lead Scoring
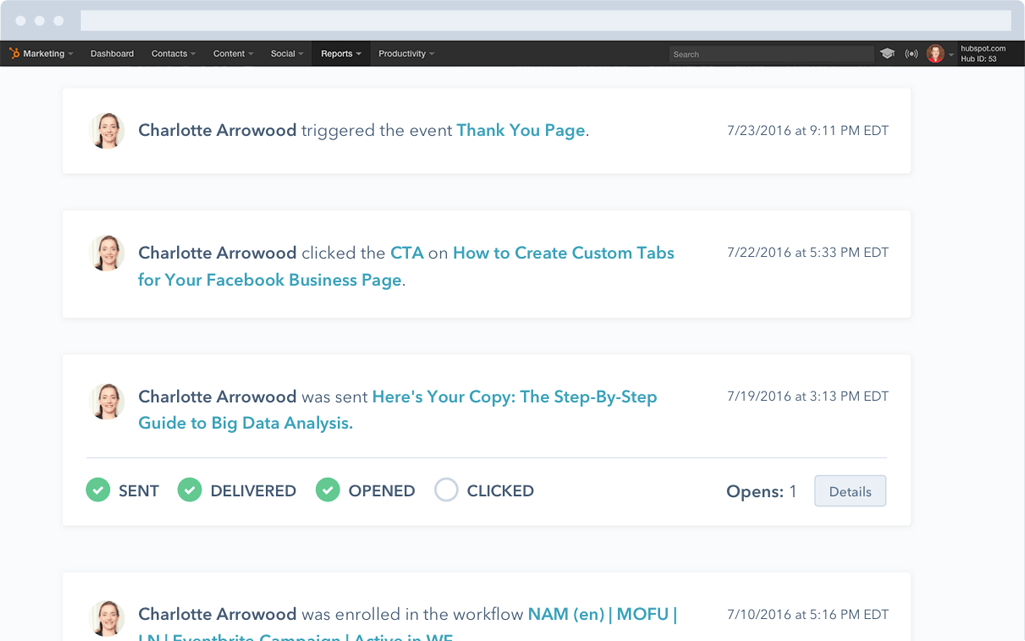
After a visitor becomes a lead, you will have access to great insights about that person as they work their way through your sales funnel. Click on their profile in your “Contact” list and you can see:
- Which forms they’ve filled out and what information they provided
- Whitepapers and other content offers they’ve downloaded
- Their lifecycle stage (Lead, Marketing Qualified Lead, Sales Qualified Lead, Opportunity, and Customer)
- Emails they’ve opened, and whether they clicked on links within them

Image Provided by HubSpot
You can also set up lead scoring to filter your contacts based on lifecycle stage, engagement with your content, and other criteria that qualify (or disqualify) them as a good prospect. By assigning values to different actions and attributes, you can evaluate your leads and prioritize the ones who make the best fit for your company.
This data also links to the HubSpot CRM where you can manage proposals, enroll prospects into outreach workflows, and monitor all interactions with your leads.
Blog & Page Performance
As I mentioned, blogging is the engine that drives lead generation, so it’s important to measure how your content is attracting and converting visitors.
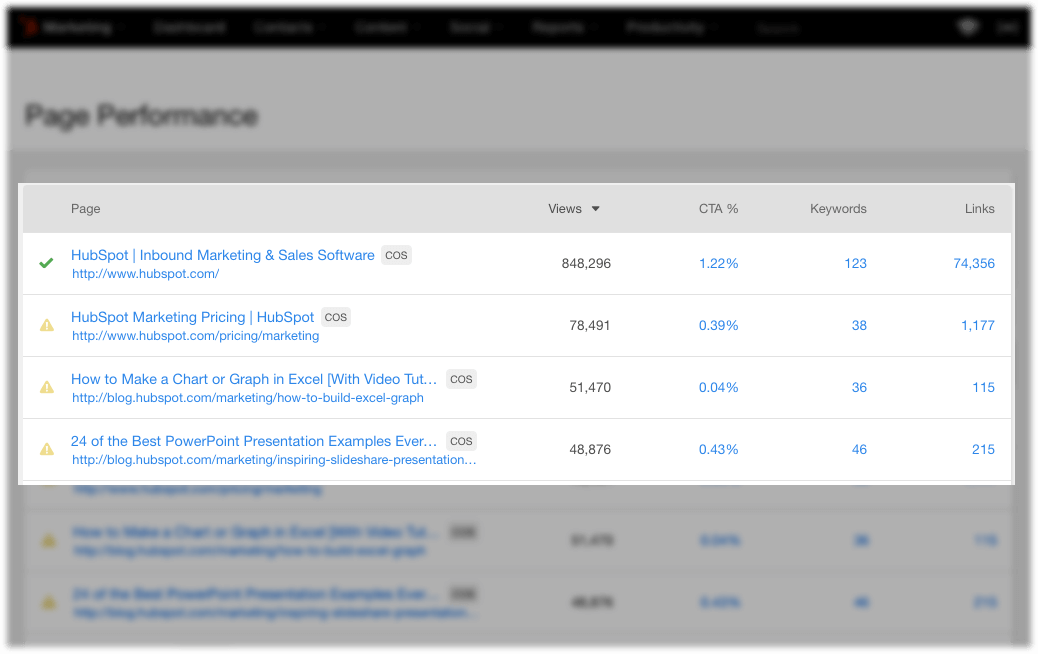
From the “Blog” tool, click on the “Analyze” tab and you will immediately see how many views and subscribers you’ve gotten compared to another timeframe. Proceed down to the list of blog posts and you can sort them by views, CTA clicks, and click-thru-rates.
This is important information because it helps you see the topics your customers are most interested in and the offers (CTAs) they are responding to. Using this data, you can optimize your blog and conversion paths to maximize the leads you are getting. Likewise, you can also see how these metrics apply to your static website pages in the “Page Performance” tool.

Sources
Using the “Sources” tool, you can discover where your visitors, leads, and customers are coming from, helping you see which sources provide the greatest ROI along with ones that are underperforming. You might think you know where your customers are coming from, but I find there are always a few surprises lurking in these numbers.
Too many organizations have been burned by crummy marketing analytics that provide zero proof of ROI.
When you start working with a platform designed to help you generate leads and sales, then you’ve made a real investment in your business. Clicks and impressions are great. Facebook likes and retweets are dandy. But wouldn’t you rather check your analytics and see new customers instead?
Are you are struggling to convert leads on your website?
We will do it for you. Our clients get 5-10 new leads each week on average, and the ones that close are often worth $150,000 or more. Let us explain how we do it.
{{cta(‘dc43448e-f274-48af-bdf0-df204a2dd971’)}}

